Confirming you are not from the U.S. or the Philippines

Dengan memberikan pernyataan ini, saya mengaku dan mengesahkan bahawa:
  • Saya bukan seorang warganegara atau pemastautin A.S.
  • Saya bukan warga Filipina
  • Saya tidak memiliki secara langsung atau tidak langsung lebih daripada 10% saham/hak mengundi/faedah pemastautin A.S. dan/atau di bawah kawalan warganegara atau pemastautin A.S. yang dilaksanakan dengan cara lain
  • Saya tidak berada di bawah pemilikan langsung atau tidak langsung lebih daripada 10% saham/hak mengundi/faedah dan/atau di bawah kawalan warganegara atau pemastautin A.S. yang dilaksanakan dengan cara lain
  • Saya tidak berafiliasi dengan warganegara atau pemastautin A.S. dalam terma Bahagian 1504(a) FATCA
  • Saya menyedari akan liabiliti saya kerana membuat pengakuan palsu.
Untuk tujuan pernyataan ini, semua negara dan wilayah bergantung A.S. adalah sama dengan wilayah utama A.S. Saya memberi komitmen untuk mempertahan dan tidak mempertanggungjawabkan Octa Markets Incorporates, pengarah dan pegawainya terhadap sebarang sebarang tuntutan yang timbul dari atau berkaitan dengan sebarang pelanggaran pernyataan saya ini.
Back

GBP/USD Price Analysis: Needs to spend more time amid volatility contraction

  • A minor rebound in risk-off impulse has dragged the cable below 1.1300.
  • The DXY has reclaimed the critical resistance of 112.00.
  • A symmetrical triangle formation indicates a consolidation head.

The GBP/USD pair has witnessed mild selling pressure and has dropped below the critical support of 1.1300 in the early European session. A soft decline in the S&P500 futures has delivered a rebound in the risk-off profile. The US dollar index (DXY) has reclaimed the critical resistance of 112.00 and has also delivered an upside break of the morning consolidation range.

On an hourly scale, the cable is oscillating in a Symmetrical Triangle chart pattern that signals a volatility contraction. The upward-sloping trendline of the chart pattern is placed from October 12 low at 1.0924 while the downward-sloping trendline is plotted from October 5 high at 1.1496.

The 50-period Exponential Moving Average (EMA) at 1.1291 is overlapping with the asset, which indicated a rangebound structure.

Also, the Relative Strength Index (RSI) (14) is oscillating in a 40.00-60.00 range, which indicates the unavailability of a potential trigger.

Going forward, an upside break of October 17 high at 1.1440 will drive the cable towards September 14 high at 1.1590, followed by September 13 high at 1.1738.

On the flip side, a drop below Friday’s low at 1.1060 will drag the asset toward the psychological support of 1.1000. If cable surrenders the psychological support, it will expose to more downside towards October 12 low at 1.0924.
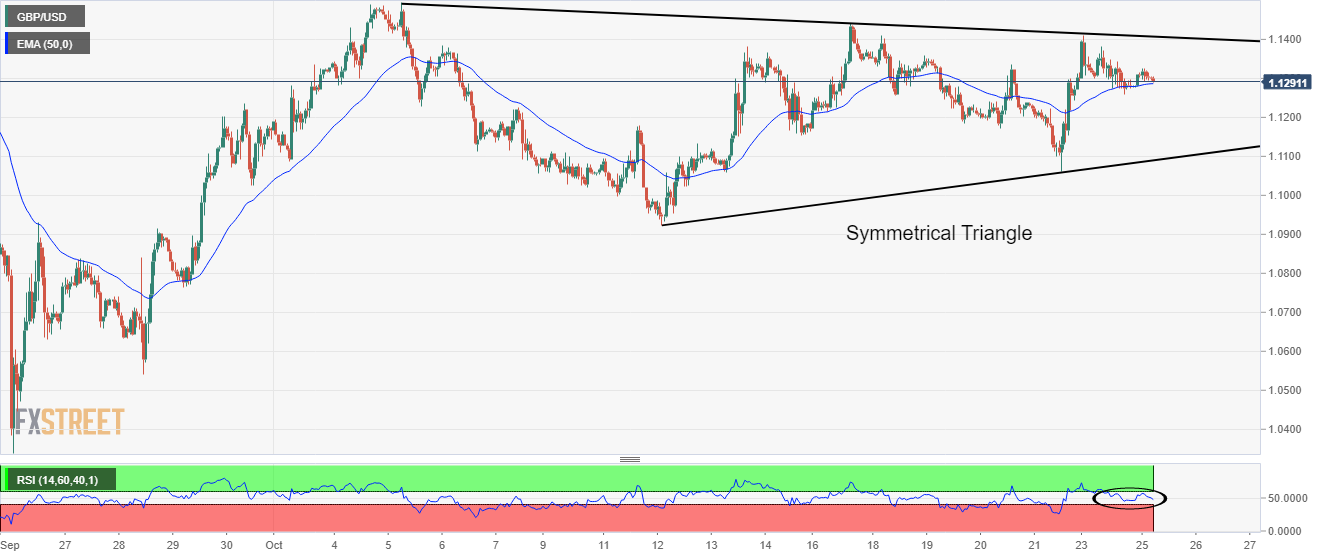
GBP/USD hourly chart


Sweden Producer Price Index (YoY) above expectations (19.9%) in September: Actual (20.6%)

Sweden Producer Price Index (YoY) above expectations (19.9%) in September: Actual (20.6%)
Baca lagi Previous

EUR/USD: There will likely be a deadlock for now – Commerzbank

EUR/USD remains to trade below the 0.99 mark. Economists at Commerzbank note that there is a deadlock in the world's most popular currency pair. The s
Baca lagi Next