Confirming you are not from the U.S. or the Philippines

Dengan memberikan pernyataan ini, saya mengaku dan mengesahkan bahawa:
  • Saya bukan seorang warganegara atau pemastautin A.S.
  • Saya bukan warga Filipina
  • Saya tidak memiliki secara langsung atau tidak langsung lebih daripada 10% saham/hak mengundi/faedah pemastautin A.S. dan/atau di bawah kawalan warganegara atau pemastautin A.S. yang dilaksanakan dengan cara lain
  • Saya tidak berada di bawah pemilikan langsung atau tidak langsung lebih daripada 10% saham/hak mengundi/faedah dan/atau di bawah kawalan warganegara atau pemastautin A.S. yang dilaksanakan dengan cara lain
  • Saya tidak berafiliasi dengan warganegara atau pemastautin A.S. dalam terma Bahagian 1504(a) FATCA
  • Saya menyedari akan liabiliti saya kerana membuat pengakuan palsu.
Untuk tujuan pernyataan ini, semua negara dan wilayah bergantung A.S. adalah sama dengan wilayah utama A.S. Saya memberi komitmen untuk mempertahan dan tidak mempertanggungjawabkan Octa Markets Incorporates, pengarah dan pegawainya terhadap sebarang sebarang tuntutan yang timbul dari atau berkaitan dengan sebarang pelanggaran pernyataan saya ini.
Kami berdedikasi terhadap privasi anda dan keselamatan maklumat peribadi anda. Kami hanya mengumpul e-mel untuk memberi tawaran istimewa dan maklumat penting tentang produk dan perkhidmatan kami. Dengan memberikan alamat e-mel anda, anda bersetuju untuk menerima surat sedemikian daripada kami. Jika anda ingin berhenti melanggan atau ada sebarang soalan atau masalah, tulis kepada Sokongan Pelanggan kami.
Octa trading broker
Buka akaun dagangan
Back

EUR/GBP Price Analysis: Pair holds neutral bias at the start of the week

  • EUR/GBP trades near the 0.85 area after slipping during Monday’s session.
  • Momentum indicators remain mixed, with shorter-term signals leaning bearish.
  • Key support rests near 0.8498, while resistance zones cluster around 0.8525.

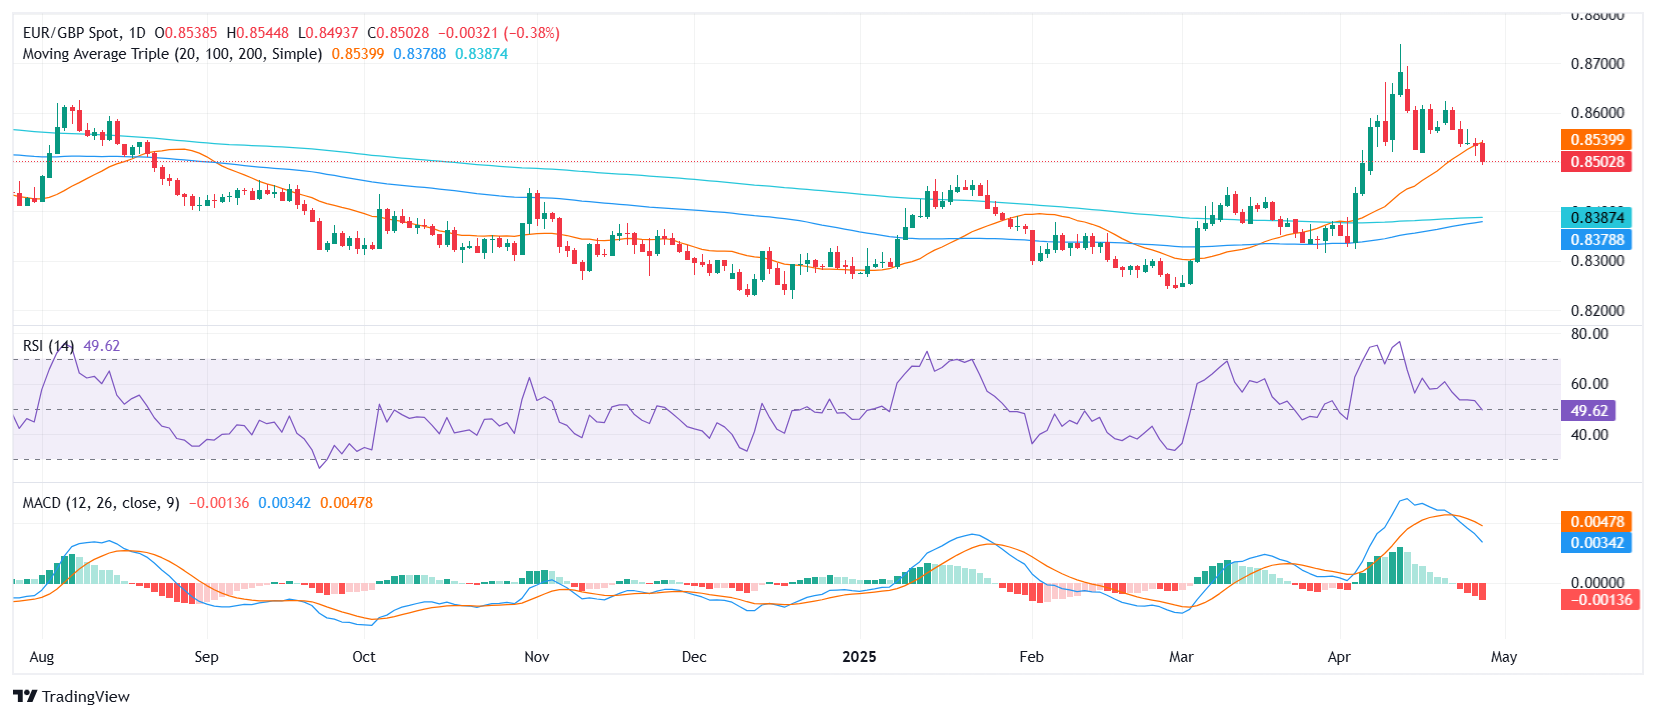
After Monday’s European session, the EUR/GBP pair was seen trading near the 0.85 zone, having moved lower earlier in the day. The pair slipped moderately and remains neutral overall, staying contained within today’s trading range. On the technical front, the Relative Strength Index (RSI) holds close to the 50 mark, showing neutrality, while the Moving Average Convergence Divergence (MACD) presents a sell signal. Other momentum indicators like the Williams Percent Range and the Ultimate Oscillator also display neutral stances. Meanwhile, a divergence between shorter and longer-term moving averages suggests some underlying uncertainty.

On the technical side, shorter-term pressure is evident, with the 20-day Simple Moving Average (SMA) near 0.8540 flashing a bearish signal as the pair trades beneath it. However, longer-term support persists, as both the 100-day SMA around 0.8379 and the 200-day SMA near 0.8389 continue to suggest a bullish trend over a broader horizon. The Ichimoku Base Line, flat around 0.8527, reinforces the neutral bias for now.

Support for EUR/GBP is located around the 0.8498 mark, followed by deeper cushions near 0.8482 and 0.8459. On the upside, resistance can be seen near 0.8515, with additional barriers at 0.8525 and 0.8527. Given the combination of a sell signal from the MACD and neutral readings from the Williams Percent Range and Ultimate Oscillator, the pair could remain in consolidation unless either buyers or sellers take stronger control in the next sessions.

Daily Chart
GBP/USD rallies and hovers near 1.3400 amid US Dollar weakness

The Pound Sterling begins the week positively set to end April strong, is up 0.65% as the Greenback continues to weaken and risk appetite improves. At the time of writing, the GBP/USD trades near 1.3400 after bouncing off daily lows of 1.3279.
Baca lagi Previous

USD/CHF Price Analysis: Dollar weakens against Swiss franc amid bearish pressures

During Monday's session, USD/CHF was seen trading near the lower end of its daily range, moving around the 0.82 area after dropping by nearly half a percent. The pair continues to face a bearish overall sentiment, reinforced by the performance of technical indicators.
Baca lagi Next