
Spread dan syarat terbaik kami
 Ketahui selanjutnya

USD/INR stays modestly changed to 71.48 amid the initial Indian session on Thursday. The pair dropped towards retesting the weekly low of 71.35, flashed yesterday, as taking rounds to 71.38 at the open. However, mild recoveries could be spotted after a heavy fall the previous.
Read: Moody’s: India's fiscal flexibility hindered by high debt burden, weak debt affordability
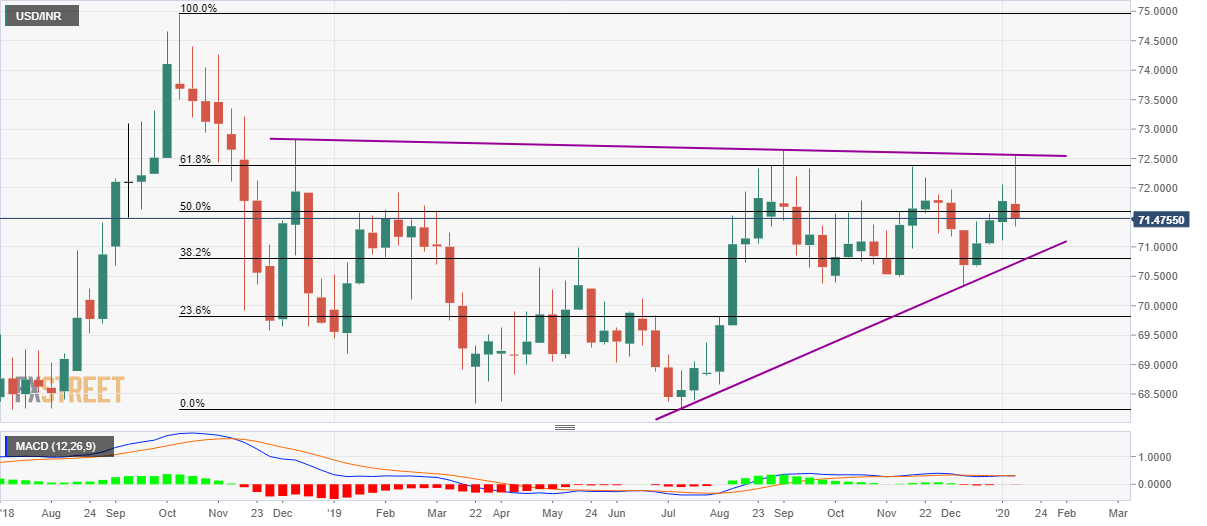
Even so, the pair stays on the back foot while reversing from a downward sloping trend line since mid-December 2018, also observing the declines below 50% Fibonacci retracement level of October 2018 to July 2019 fall.
With this, USD/INR prices are likely to keep the losses while targeting 71.00 and 38.2% Fibonacci retracement level of 70.80. However, an upward sloping trend line since July 2019, near 70.72, can cure the pair’s further weakness ahead of 70.00 psychological magnet.
On the upside, 72.00 can offer immediate resistance ahead of 61.8% Fibonacci retracement, at 72.40, also prior to challenging the multi-month-old resistance line that currency stays near 72.57.
In a case where buyers manage to take-out the 72.57 mark, December 2018 top surrounding 72.82 will hold the keys to pair’s rise towards 73.00.
Trend: Pullback expected


