Back
28 Feb 2020
Gold Price Analysis: XAU/USD tumbles near two-week’s lows, sub-$1600/oz
- XAU/USD bulls gave up as sellers took the market down sharply.
- More down could be on the cards for the yellow metal.
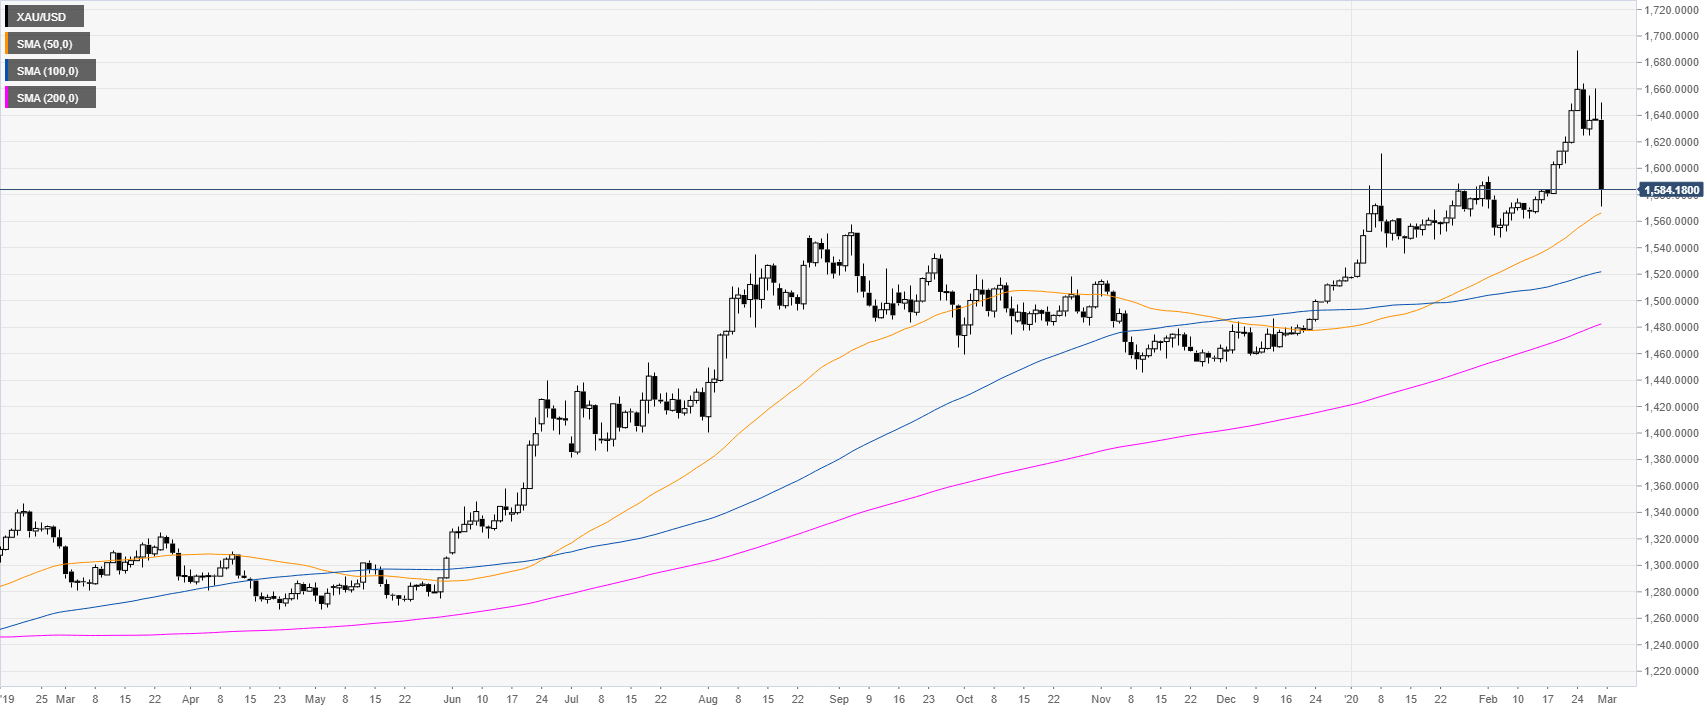
Gold daily chart
XAU/USD is trading in a bull trend above its main daily simple moving averages (SMAs). However, the market is pulling down sharply trading off seven-year’s highs.
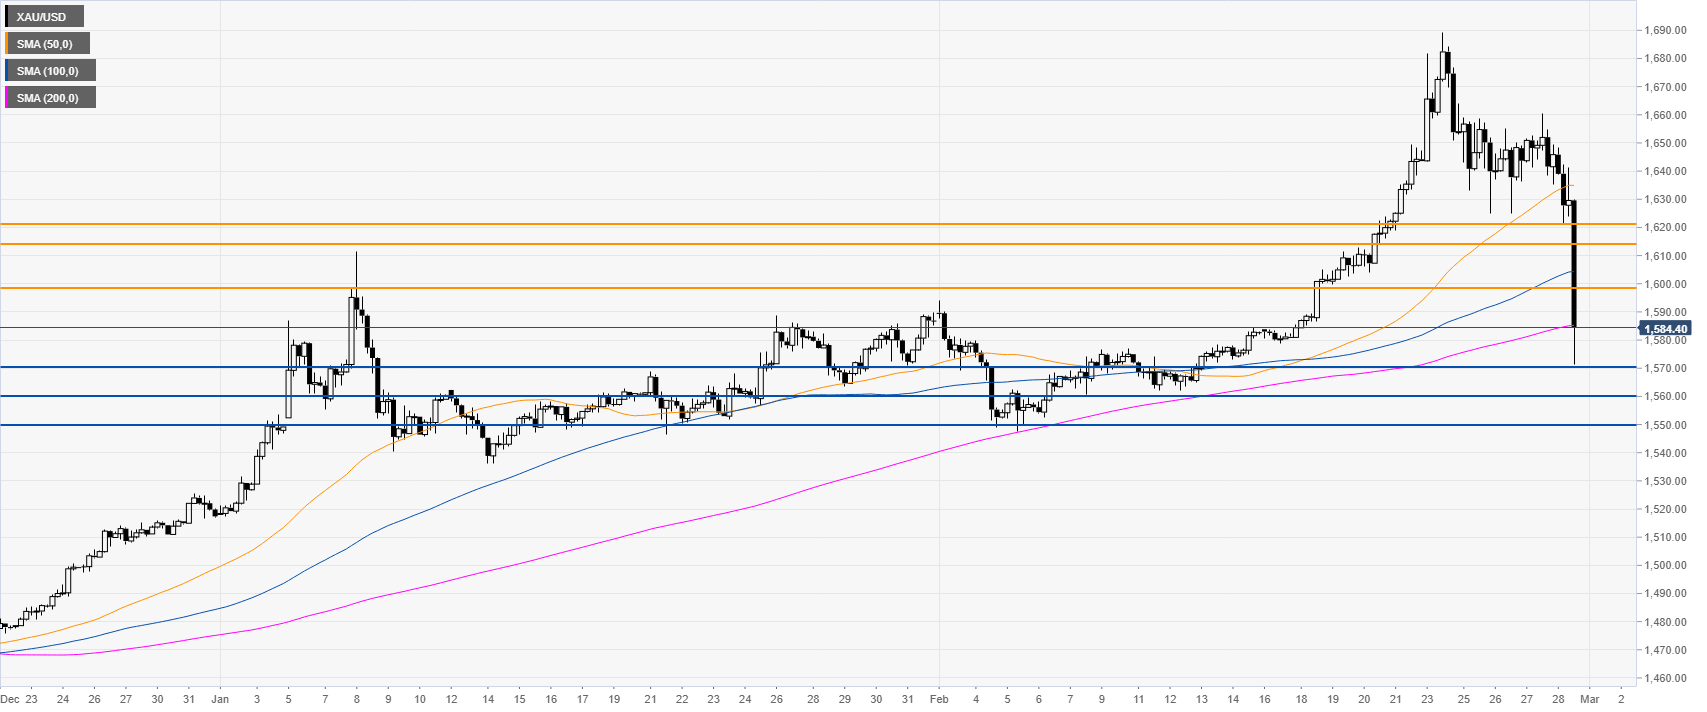
Gold four-hour chart
Gold has been dropping sharply this Friday while reaching the 200 SMA on the four-hour chart. The bears seem to be in charge and more down could potentially be expected. Sellers can try to drive the market down towards the 1599.00, 1612.00 and 1621.00 support levels. Resistance can be expected near the 1599.00 and 1612.00 levels.
Resistance: 1599.00, 1612.00, 1621.00
Support: 1570.00, 1560.00, 1550.00
Additional key levels